Archive
Ephemeris: 02/13/2026 – The real cause of a planet’s retrograde motion
This is Ephemeris for Friday, February 13th. Today the Sun will be up for 10 hours and 22 minutes, setting at 6:08, and it will rise tomorrow at 7:44. The Moon, halfway from last quarter to new, will rise at 6:30 tomorrow morning.
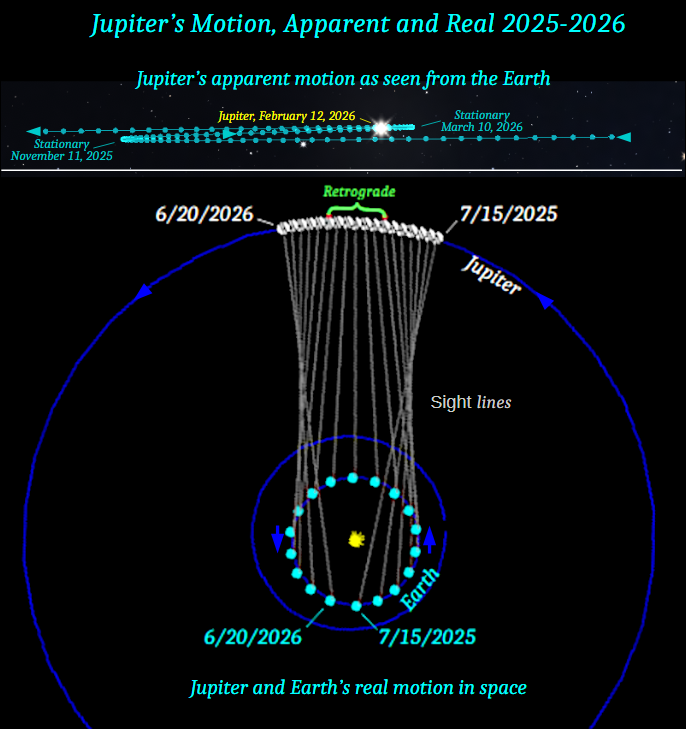
So what is the real reason that Jupiter is currently moving westward for a while in retrograde motion? Retrograde motion occurs in outer planets because the Earth is actually passing them. A simple analogy would be, if you were in a car that was passing another, the car you are passing would seem to move backwards compared to you. And that is exactly what’s happening. The Earth moves faster than the outer planets. Since the solar system is like a racetrack, and we get to lap these outer planets repeatedly when they are closest to us. For the inner planet it’s opposite. They go retrograde or backwards when they are passing us. This is a much simpler answer than all these circles upon circles the ancients invented.
The astronomical event times given in this blog are for the Traverse City/Interlochen area of Michigan (Lat 44.7° N, Long 85.7° W; EST, UT – 5 hours) unless stated otherwise. Times will be different for other locations.
Addendum